In today’s technology and data driven landscape, some of the largest business expenditures are allocated towards software. This may include investment in the form of tech startups developing the platform which will generate revenue, tech-enabled companies seeking enterprise software or automation that will cut long-term costs, companies seeking to make sense of raw market data, control logic for embedded systems, and virtually every other kind of software-based venture. Upon reading this article, the reader should gain a basic understanding of project selection using metrics such as Internal Rate of Return (IRR), hurdle rates, opportunity cost, requirement identification using methods such as creating personas, requirement communication using engineering documents such as Unified Modeling Language (UML) for the back-end and wireframes for the front-end, and finally, verifying and shaping software investment via Quality Assurance (QA) processes.
What difference does it make how much you have? What you do not have amounts to much more. - Seneca the Younger
A universal challenge that every business entity experiences is that of scarcity. The competency in leveraging the limited resources available is often what determines the fate of an entity. Thus, the necessity arises in accurately selecting which projects to allocate resources towards, identifying the requirements for those selected projects, fully communicating the requirements to the engineering team, and assuring the requirements have been met correctly upon completion. It is only upon the understanding and execution of the process just mentioned that one may invest in software with minimal risk and receive a software platform that conforms closely to the original vision.
Establishing Business Strategy and Investment Philosophy
It is recommended that the first step an entity takes in selecting its investments is conducting business analysis that gets reflected into a business plan or strategy, and acquiring a set of goals and philosophies that guide future behavior such as investment selection. This is a living, breathing document that outlines the organization’s goals, philosophy, competitive approaches, market information, and financial information. The United States Small Business Association has great content regarding business plan creation that can be found here.
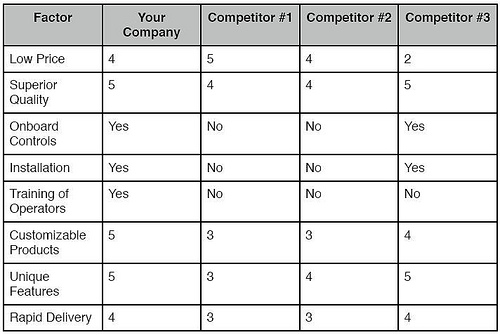
Among the most important sections of this plan is that which is concerned with market analysis. Information about the competitors, customers, and the market as a whole provides a great background for the development of a goal and strategy. The creation and ongoing maintenance of a competitive matrix within the business plan is, thus, a vital tool in determining whether the entity will compete on exclusively price or differentiation. Further, the activities of the competing businesses and their corresponding results may be observed in order to lessen the learning curve into market domination.
On the demand side of the market, target demographic analysis should be conducted to determine key consumers, their preferences, and their real income. This is where it is suggested to begin creating personas, or fictional representations of the target demographic groups, including names, ages, interests, real income, and so forth. Because acknowledgment of the nature of the end-user is vital to the firm’s success, these personas will be referred to all stages of the investment process. Surveys completed by the target customers should help the entity determine their services’ indifference price points (IPP) as well as some preliminary requirements and use cases.
In order to optimize the return on investment, a value based pricing approach centered around the Price Sensitivity Meter (PSM), which incorporates the IPP, should be used. Some questions that need to be asked to the target customers to determine this figure are:
What is the maximum price you would consider paying for this service?
What is the minimum price you would pay without having concerns as to the quality of the service?
What is a price you would pay for this service, but give significant consideration as to whether it is too high?
What is a price you would pay for this service that makes you feel as if you received a bargain?
After surveying a good sample size of the target demographic, a plot of each individual’s “expensive” curves and “cheap” curves may be created, where the expensive curves are composed of drawing a line between the prices determined from questions 1 and 3 above, and the cheap curves are composed of drawing a line between the prices determined from questions 2 and 4. Where this line intersects is the individual’s IPP. The mean value of all the individual’s IPPs may be calculated in order to determine the market IPP, or the target price for the service.
For the sake of completeness, the other two primary methods of price determination will be mentioned: cost-plus and competitor proxy. In cost-plus pricing, a predetermined profit margin is set above operating cost. This is the least effective method of pricing. The competitor proxy method simply reflects the pricing used by the competitors. Of course, there are several other methods for pricing; however, the three listed are the ones used most often.
From the supply and demand side market analysis, financial forecasts as a function of sales may be created. The operating cost, revenue, and profit forecasts are all used in determining a firm’s method of competition. For example, a firm with high fixed costs, such as an airline company, may wish to compete on price in order to cover these costs as quickly as possible.
Another challenge that a firm with high fixed costs may experience is that related to its economies of scale, which directly impact its returns on investments. There are two approaches to this dilemma; the firm may either invest a large amount of upfront capital to optimize production while maybe operating at a fraction of capacity until sales can catch up, or the firm may scale according to its capacity, in which case it will not realize its potential profits. Both of these approaches are valid given certain contexts and should be considered seriously when crafting an investment strategy.
With the competitive and financial landscape in mind, an executive summary should be crafted that reflects the goals and strategies of competition for the entity. From this, all the possible projects that will help movement in the direction of the goals given the entity’s current state may be enumerated. At this stage, it should be simple to identify which projects are necessary to the self-preservation of the entity, how the projects rank according to the entity’s competitive strategy, how the projects will shape internal operations, and which projects induce revenue versus those that cut cost, eliminate risk, or provide a differentiating feature.
Selecting Investments
Each business entity in existence faces a wall of constraints in the form of financial capital, temporal capital, and labor, among all the other factors of production. Further, most firms, unless they have achieved the ultimate goal of capitalism to become a monopoly or a protected member of an oligopoly, are fighting a bloody warfare against their competitors for market share in what is referred to as a “perfectly competitive market.” Thus, a firm’s route to self-preservation and growth needs to reflect its competitive landscape given its internal constraints.
After a thorough qualitative analysis of the business, its goals, and its competitive approach has been executed, a quantitative analysis is able to determine the next actionable steps a company should take. This article will focus on technology-based projects; however, the process is the same for all projects and is standard in corporate finance. This section helps explain how to identify the next software investment to be made, whether it is an out-of-the-box solution, a fully custom solution, automation software, or anything else software-based.
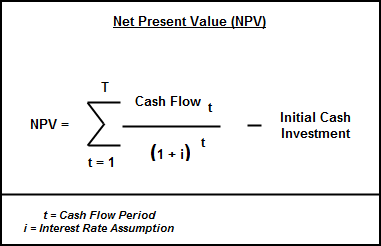
Net Present Value (NPV) may be thought of as the summation of all the cash flows discounted to today’s value using a discount rate, which is typically determined from the Weighted Average Cost of Capital (WACC) incurred by the firm. One cannot simply apply the summation of all the individual cash flows because Time Value of Money (TVM) dictates that a dollar in the hand today is worth more than a dollar that will be received one year from now, due to the opportunity cost of possible investments during that time period. The NPV for all the potential investments must be calculated, where, given the discount rate, a positive NPV indicates the project will be profitable and a negative NPV warns about undertaking the project in the first place. The NPV of a project may be calculated using the formula below.
It is, however, much simpler to use a spreadsheet tool such as Microsoft Office or LibreOffice Calc to determine this figure.
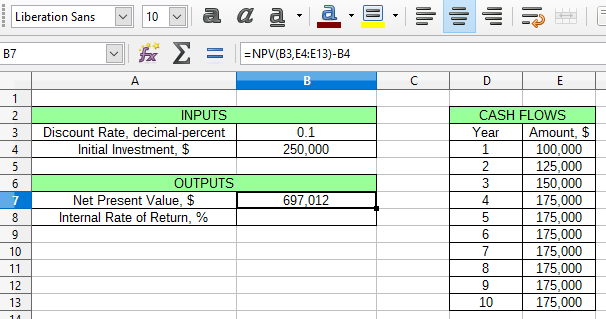
The Internal Rate of Return (IRR) of a project is defined by the interest rate at which all cash flows equal zero using the Net Present Value equation. A higher IRR tends to indicate a higher Return on Investment (ROI). However, it is important to keep in mind that IRR reflects an interest rate, and that the actual magnitude of the returns needs to be kept in mind as well. Once a series of cash flows, starting with the initial investment, have been forecast, determining the IRR is simple with a spreadsheet tool and the irr() function, similar to how NPV was calculated in the example above.
Note that the issuance of debt by the company will affect the cash flows. A levered company will experience cash flows with lesser magnitude than those of its hypothetical unlevered clone firm. As the debt-to-equity ratio increases, the beta, or volatility, of the company increases as well. This signifies the fact that variance in equity distributions are at the mercy of repayment to creditors. The beta will be used in determining another key metric, the hurdle rate, that will be used in the investment selection model. Further, note that the cash flows used by the models are nominal, and not real. This means that they neglect outside factors such as inflation.
The hurdle rate is the “hurdle” interest rate return that a project must leap over in order to be considered for selection. There are several valid methods used for determining this figure. The most common of these involves using the capital asset price model to determine the risk-adjusted hurdle rate.
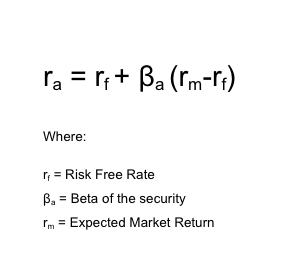
As the formula above demonstrates, a greater value in beta indicates higher risk and will yield a higher hurdle rate. Some companies opt out of the risk adjusted hurdle rate determination altogether and instead use other metrics, such as their WACC or even arbitrary values.
Projects with IRRs lesser than that of the hurdle rate may now be eliminated from consideration. There is one caveat, though, and it comes in the form of opportunity cost. For example, the development of the core revenue generating platform carries with it great risk, which, if quantified, might be reflected in a hurdle rate significantly higher than any currently quantifiable IRRs. However, not undertaking this project would signify the firm choosing to not pursue the enterprise entirely. That is a massive opportunity cost that the firm, if they do wish to compete in the industry, cannot incur. Further, companies with large economies of scale wishing to starve competitors out of business may offer their services below their marginal cost of production, incurring a temporary loss for a long-term strategy.
Thus, it is apparent that IRR, NPV, hurdle rate, and opportunity cost, are merely tools to be used in a broader, more comprehensive analysis. This is typically where methods such as minimax decision tree analysis and real options valuation come into play in order to make the most effective decision possible, given current market conditions and risk. In the end, portfolio and project selection are an art that are best done after hands-on experience has led to an innate feel for the mechanics of a particular industry.
Identifying Project Requirements
Once resources have been selected to be devoted towards a project, identifying the software requirements comes next. This step entails the creation of a software profile, the preliminary documentation detailing the behavioral and structural analysis of the system that will be used to build the engineering documents in the next phase. Determining the solutions to the general questions below help guide the investment team in the right direction.
For what problem(s) is this software a solution? Some potential problems may be that the business has not yet developed the platform central to its revenue generation model, that the firm needs to make sense of its raw data to determine market trends, the increase in automation and efficiency needs to be brought about to decrease operating costs, and so forth.
Will this software be for enterprise, consumer, or business use?
Who are the end users of the system? Enumerate every type of end-user and their corresponding persona.
What will be each of the end users’ actions? Enumerate every possible workflow they may face. For example, one administrator workflow may be to add new employees to the system.
Is the software to interface with other technical systems? If so, which ones are they? For example, does the software need to interface with third party software or a previously developed company database?
Are there any liabilities, such as PCI compliance or private user information, that must be addressed in the design?
Is the system required to warehouse and/or analyze big data, meaning data that cannot be computed on a single node? If you can open the data set in Excel without depleting your RAM and virtual memory, it is not big data. If so, will this big data be analyzed retrospectively or live via a stream? What type of analysis needs to be performed on the data? What is the process for actually warehousing the data once it has been used?
Across what systems will the software be deployed? Enumerate every platform, such as web server, mobile phone, VPN-connected office desktop, and so forth, over which this software will run. How will the software be deployed? For example, will it be hosted on a web server for mobile phone apps to query?
The next and final portion of the requirement gathering phase is to differentiate core functionality from features. By separating the functionality requirements into these two categories, a better deployment plan may be formulated. Many times, a product encapsulating the core functionalities will be pushed out as soon as possible, whether it is to production or to the beta testing process, allowing minimal capital expenditure and temporal opportunity cost. This also allows the company to refine the core functionality offering sooner than later before finalizing the features. These features are typically added afterwards and yield diminishing marginal returns to the end product.
Communicating Project Requirements
If you are a stakeholder in a technology-enabled company, then it is vital for you to be able to concretely grasp the layout of your supporting technologies. Just as how a stakeholder in the construction of a skyscraper would need to be familiarized with building plans and blueprints, a software stakeholder would need similar engineering and architectural documentation for accurate assessment and decision making. Along these lines, software investments must be described by both the requirements of the functionality, or back end, of the system, and those of the user experience (UX), or front end.
Describing the Back End
The back end of the platform is communicated to the technical team via Unified Modeling Language (UML). UML entails 14 different types of diagrams that describe the behavioral and structural components of the system, although not all of them need to be used to fully and accurately describe the software, and only the higher-level diagrams need to be created by the business team before handing them off to the technical team, who may complete the rest.
The first question that needs to be addressed pertains to who will use the software? The list of user types generated in the previous phase may now be reflected onto a diagram in the form of stick figures, ideally with their personas labeled adjacent to them. The next question to be tackled is for what will they use the software? Bound to the stick figures with a connecting line may now be placed scenario bubbles that describe the users’ actions on the system. This is the simplest, yet one of the most important, UML diagrams and is referred to as the use case diagram.
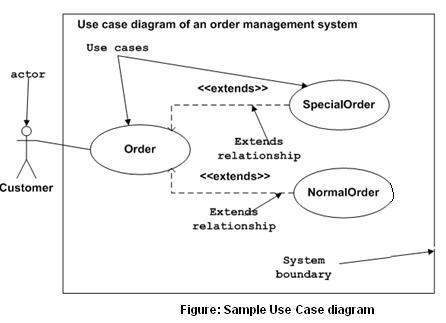
It is a good idea to have only broad actions represented by the scenario bubbles connected to the user. If further sub-actions comprising the broad action are required to eliminate design ambiguity, then they may be attached to the generic scenario bubble. The broad actions are typically referred to as sea-level actions and the individual processes that comprise these are referred to as fish-level actions. The bottom line is that enough scenario bubbles should be included to provide an unambiguous description of the actions of each user to each of the stakeholders and developers, but they should not exceed the quantity where they clutter the diagram by describing obvious, menial tasks.
The UML diagram above handled the question of who will use the software, so the next question is how will they use the software? This is where another UML behavioral diagram called the activity diagram comes into play.
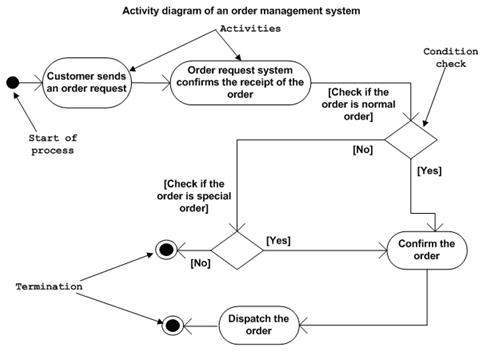
Observe that the activity diagram merely lays out all of the workflows described in the previous phase in a graphical manner that is easy to implement in the source code.
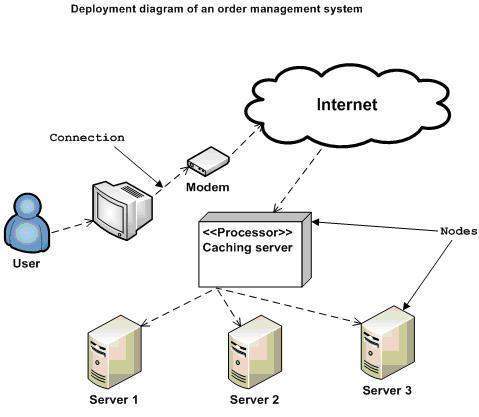
The next engineering chart that the business and investment team should create is the deployment diagram. This describes how the software is to be hosted and run. For example, a mobile app diagram would include a representation of the mobile device, the web server it interacts with, and the database server from which the web server submits queries.
Technical business and investment teams also need to be familiar with the basic concepts of Object Oriented Programming (OOP). There are several other programming paradigms, like functional programming and imperative programming; however, the business world has adopted OOP for most purposes for several specific reasons. At the core of OOP is a model of viewing the world in terms of objects, each containing attributes and methods. Take a car object, for example; it has certain attributes, such as number of doors, color, transmission type, et cetera, and methods, such as accelerate, brake, turn left, turn right, toggle the air conditioning, et cetera. A well-organized software system will be a thriving ecosystem of different objects identifying themselves with several attributes and interacting with one another and the world via their methods. There are other principles of OOP, such as inheritance, encapsulation, and polymorphism, but these are not as critical to know to the investment team, although knowledge of these subjects helps to better understand and monitor the health of the system. Because of its intuitive universal modeling perspective, OOP allows for an intuitive approach developing the software and an easier time in recruiting developers, as it is at the heart of most computer science curricula. Further, it helps to decrease technical debt, the temporal and capital expenditure that will be paid at some point in the future for maintenance and upgrades, by persuading the development of organized and self-documented code.

From knowledge of OOP, the business team may then construct what is referred to as a class diagram. All objects are instantiated from classes, blueprints that define the nature of the objects themselves. A class diagram is simply a graphical representation of how the classes interact with one another and what are their individual attributes and methods. An investor or businessperson without software engineering experience will not be able to complete these class diagrams fully; however, it is important that they understand the landscape of the software where investment is allocated as well as communicate their vision of the intrinsic nature of the objects in the system and their interactions with one another.
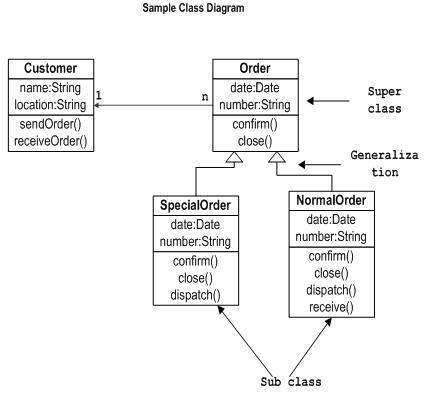
With the creation of the four diagrams mentioned above, the business team is able to better understand exactly for exactly what capital is being allocated, communicate their vision to the engineering team clearly and succinctly, and incur savings by placing the general structure and thought of their software internally, as it should be in the first place.
Some great tools that INTP uses frequently for the purposes of generating UML diagrams are PlantUML and Dia.
Describing the Front End
The front end tends to be a bit more intuitive to describe for most people. Via graphical mockups and wireframes, a business unit is able to fully communicate how they envision the front end should look, given their target demographics and corresponding personas.
A mockup is simply a visual depiction of all the screens that will interface with the end user. Many times, these may be created in Microsoft Paint, GIMP, or more specialized tools. Wireframes indicate how these screens yield to one another. For example, part of a platform’s wireframe may entail a mockup of a login screen with an arrow to a mockup of a home screen.
This is a critical stage of requirement communication, as the UX imposed onto the end user is vital for smooth adoption of the system, especially in publicly-facing software; however, it is often overlooked in importance by those new to the industry. How easily the user is able to complete the tasks required of them on the system without expending too much effort or time in figuring how to accomplish their goals, called a Natural User Interface (NUI), is often the determining factor in the success of software. This objective of the investment team is to ensure the UX may be classified as a NUI, given their target demographics, to the point that the end user exerts little to no effort in navigating around the platform, almost as if in a hypnotic trance. One interesting marketing trend that relates to this states that there are greater conversions in advertisements that appeal solely to the primitive reptilian cortex, dealing primarily with immediate base desires of the individual, than those who appeal to higher levels of the brain devoted to logic and thought, such as the neocortex. The bottom line is that greater user adoption and retention will occur once provided an environment where the end user does not have to use their brain!
Monitoring Development of Investment
Once the requirements have been handed off to the engineering team, it is important to enforce the proper project management strategy among the team so that development time is minimized and so that discrepancies between vision and platform are detected early and easily settled. The most prevalent software project management paradigm is known as agile.
The goal of Agile is to decrease the incremental development loop cycle so that investors and project stakeholders may be provided greater transparency throughout the entire development of the platform. This means that there is, at all times, a working version of the platform that may be demonstrated to the stakeholders. At the heart of many Agile operations is what is referred to as the scrum. The scrum is a quick daily meeting of all the developers on what they were able to accomplish the previous day and what will be completed the current day. It provides the entire team an opportunity to gain better perspective on the technical inner-workings of the system as a whole. If possible, it may be beneficial to the business team to be present for these brief meetings to get a better feel of the state of their investment.
A more traditional software project management paradigm is the waterfall. In this system, development is very sequential, meaning it takes longer, incurring greater investment capital, and iterations of the platform take much longer to achieve, decreasing transparency to the stakeholders as to the current state of the system. Thus, it is advised to always impose an agile project management paradigm in order to maximize the return on investment.
Performing Quality Assurance (QA) on the Investment
Once the engineering team has executed the requirements relayed to them, it is imperative to verify the integrity of the platform via the QA process. A rigorous alpha testing process, or internal testing, should be followed so that the software, once released to beta or production, offers minimal to no bugs to the end user. Ideally, the engineering team conducts a QA session prior to handing off the deliverable to the business team.
The QA process is tedious and its goal is to find as many problems with the software as possible. It typically entails going through each of the workflows enumerated in the requirement identification phase several times to ensure that they are intuitive to the end user and consistently free of bugs.
Many times, it is advised that a beta testing phase ensues, marked by exposure of a select few clients that fall into the target demographic groups to test out the platform before its hard launch into production. Working closely with the beta testers allows the business team to determine the actual ease of use of the software, as well as to receive feedback that may prompt further iterations of the software prior to release.
The final assurance of quality for the software is to release it into production and test the initial revenue-generating hypotheses. In the end, there is no greater judge for the merit of an investment than the marketplace itself.

Summary
Successful investing in software, technology startups, and technology-enabled projects entails knowledge of several principles. As in most investments, understanding basic finance principles, the nature of the industry, and the competitive approaches of a company come first. Next, the investors and stakeholders need to comprehend the more technical aspects of software engineering and project management and how they factor into the bottom line. This is especially true in startups and small businesses, where the allocation of limited free capital determines the fate of the entity. Although it is not as important when investing in large corporations, it does provide further insight as to how portfolio selection occurs, considering all of the possible projects that may be developed, how risk is factored in, and for what the capital is actually devoted.
By following the process of understanding the underlying financial principles, selecting the proper allocation of investment in the form of temporal and financial capital, identifying investment requirements, relaying these requirements to the engineering team, overseeing the development of the investment, assuring the quality of the investment, and finally, releasing it into the marketplace, software investors take maximum control over their investments.